CoST has called for stronger and more structured citizen participation in infrastructure oversight to enhance transparency, accountability, and value for money in the delivery of public infrastructure projects in Ghana.

Ghana scored a low 35.76 percent on the maiden Infrastructure Transparency Index—well below the global average—highlighting significant weaknesses in accountability, citizen inclusion, and value-for-money in how public infrastructure projects are planned and executed.
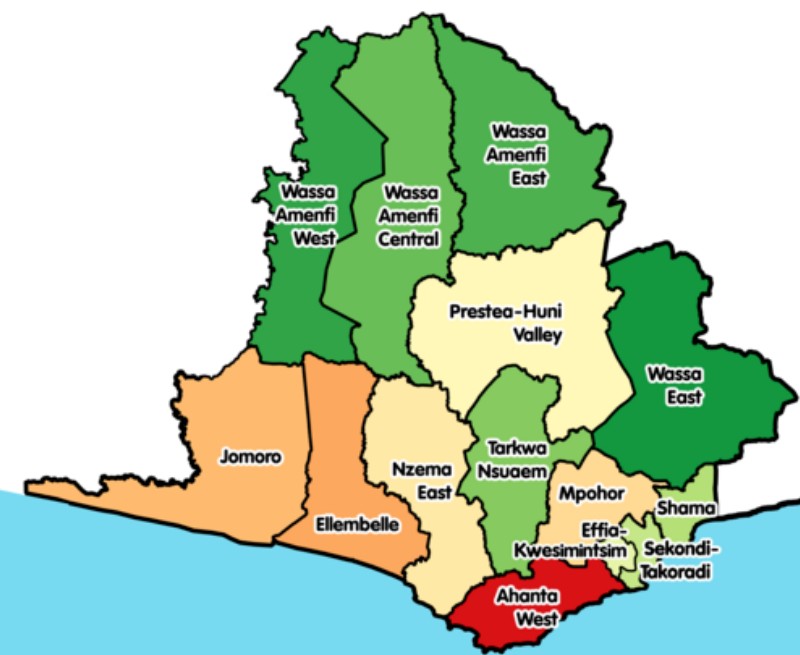
All 14 districts in Ghana’s Western Region will participate in the CoST Independent Review (Assurance) Process, expanding sub-national oversight to improve transparency, accountability, and value for money in public infrastructure delivery.
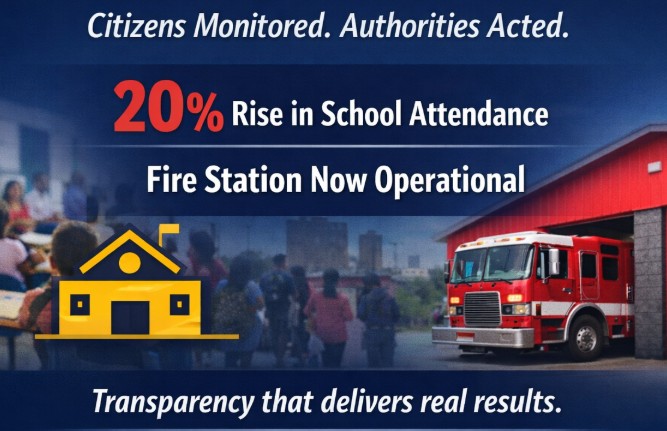
The STMA social audit demonstrates that when citizens are systematically empowered to scrutinize public infrastructure projects, transparency gaps can be corrected, service delivery improved, and tangible social outcomes achieved.
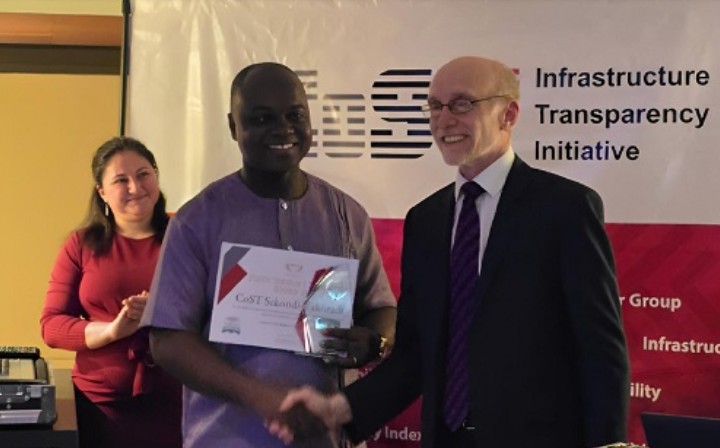
Local chapter recognised at the 2024 CoST Awards at a ceremony in London, UK on Thursday 27th February. The awards celebrate CoST – Infrastructure Transparency Initiative’s members across three continents who have promoted transparency, participation, and accountability to help achieve better lives from better infrastructure over the past year.

Ghana’s Open Government Partnership has finalised a multi-stakeholder commitment on public infrastructure transparency for inclusion in the country’s Fifth National Action Plan, aimed at improving disclosure, accountability, and citizen participation in infrastructure delivery.

CoST District Citizen Monitoring Teams in Ghana’s Western Region conducted independent social audits on 14 public infrastructure projects across eight districts, identifying gaps such as limited disability-friendly access and reinforcing the role of citizen oversight in improving transparency and accountability in local infrastructure delivery.
The Open Government Partnership story highlights how Kaduna State and Sekondi-Takoradi are using CoST standards, open contracting data, and digital infrastructure portals to improve transparency, strengthen citizen oversight, and rebuild public trust in infrastructure delivery.

The 51st Global CoST Board Meeting opened in Sekondi-Takoradi, positioning Ghana—through the Sekondi-Takoradi Metropolitan Assembly’s sub-national CoST programme—as a reference point for advancing infrastructure transparency, citizen participation, and accountable infrastructure delivery.
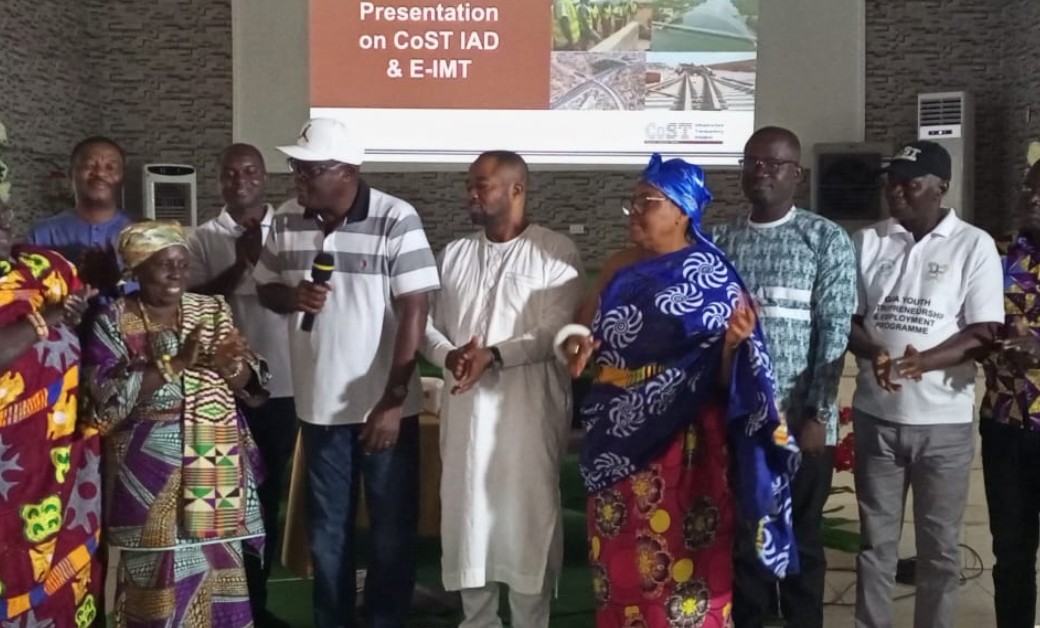
CoST Sekondi-Takoradi launched the Infrastructure Analytical Dashboard (IAD) and Electronic Infrastructure Monitoring Tool (E-IMT) to enhance transparency, data-driven oversight, and citizen participation in monitoring public infrastructure projects across the Western Region.
Ghana currently spends $1.2 billion annually on infrastructure, equivalent to 7.5% of Gross Domestic Product (GDP), yet investment in the country has not delivered full value for money. In public procurement more broadly, inefficiency and corruption is rife and in the infrastructure sector this leads to profound waste and poor quality projects.
CoST Sekondi-Takoradi is pleased to announce the initiation of an Infrastructure Transparency Survey through the use of CoST's Infrastructure Transparency Index1 (ITI).
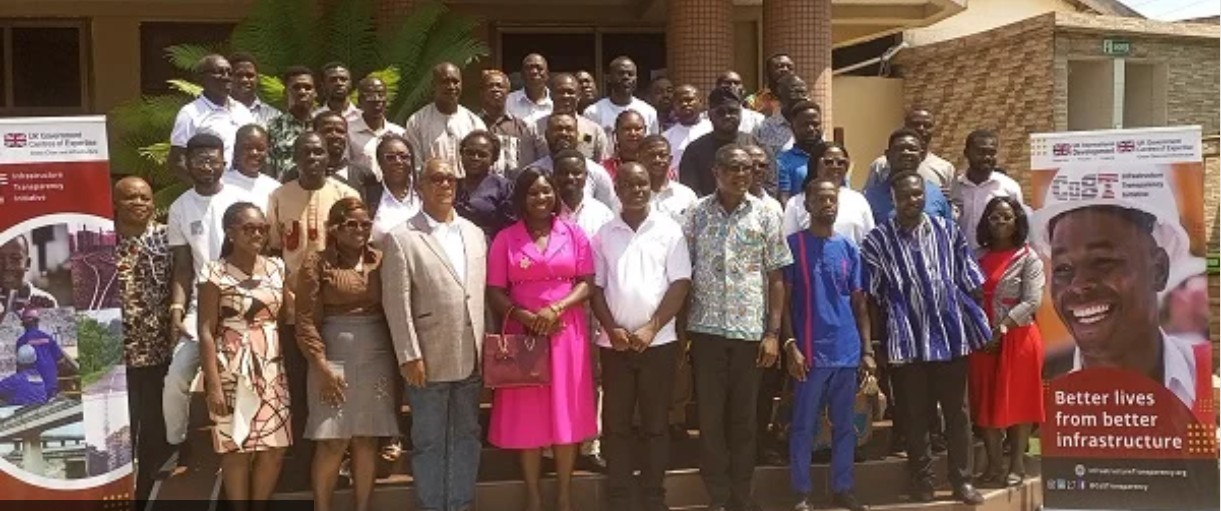
A capacity building workshop for 48 stakeholders from the eight CoST participating districts has been organised to expose them to existing laws in Ghana that enable and promote disclosure of projects and contract data.
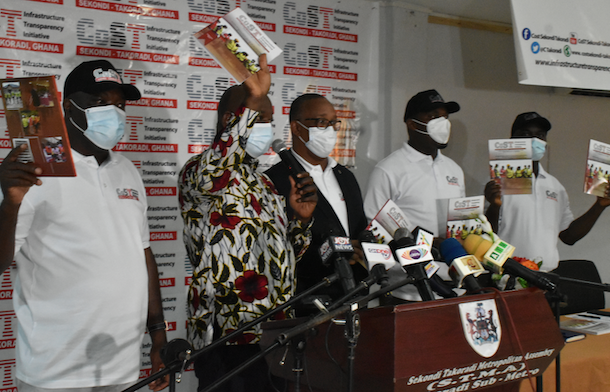
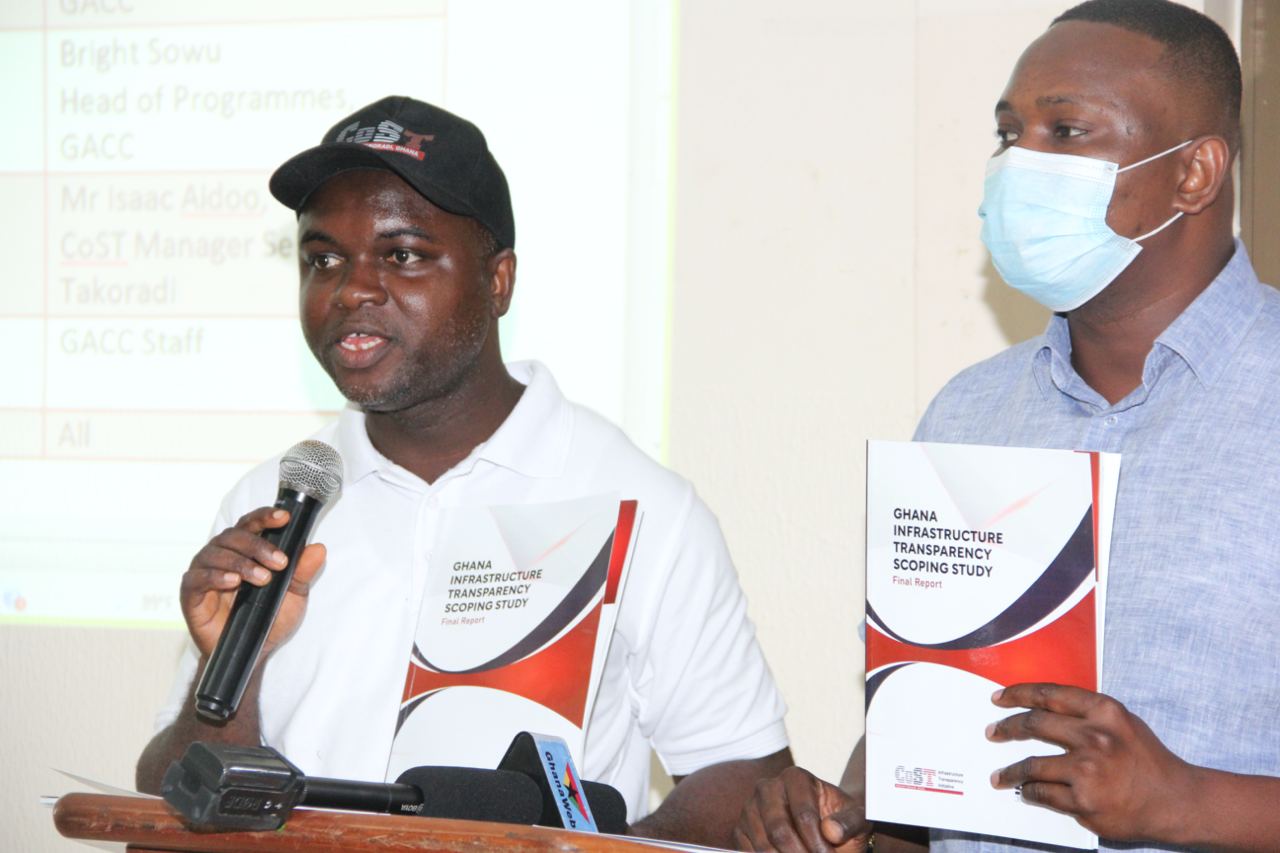
The Sekondi /Takoradi chapter of the Infrastructure Transparency Initiative, (CoST) has launched a second Assurance Report on eight projects within the Western Region.

Discussants at a round-table on Revitalising Infrastructure Investments in Ghana have identified the lack of disclosure of data on contracts as bane to concerns of fraud in the country’s infrastructural procurement.
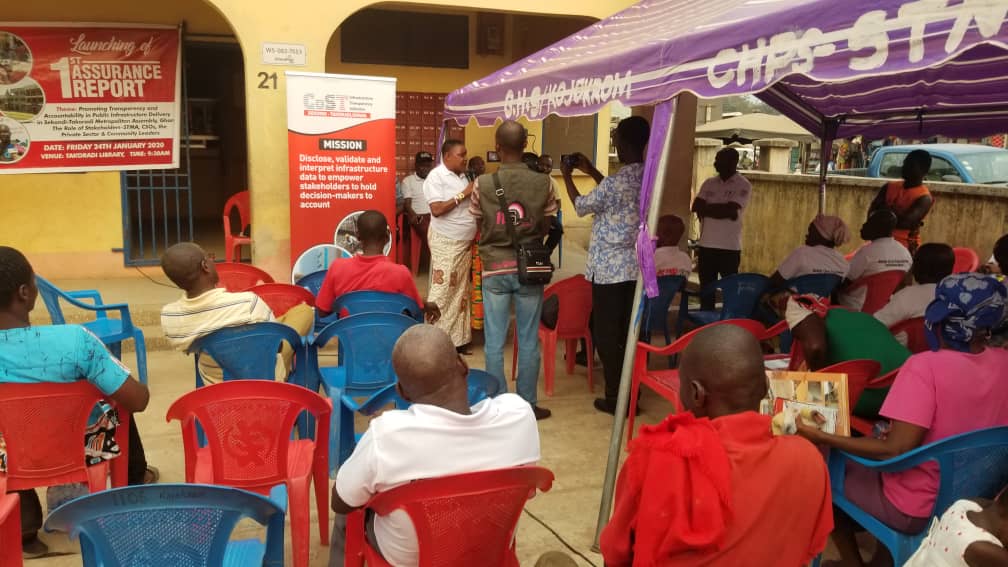
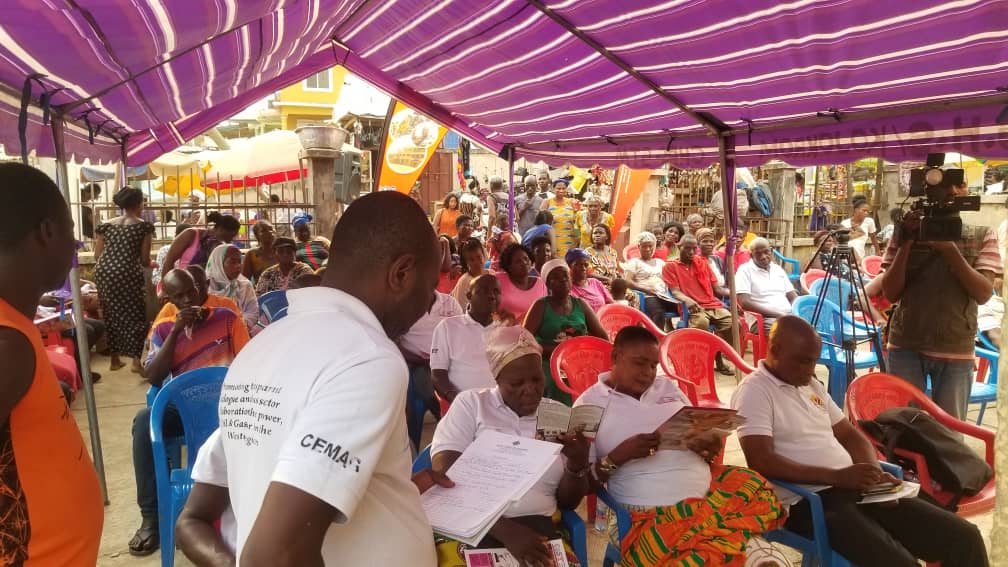
The Sekondi-Takoradi Local Chapter of the Infrastructure Transparency Initiative (CoST) has engaged two communities on its Assurance Report launched recently on five selected infrastructure projects in the area.
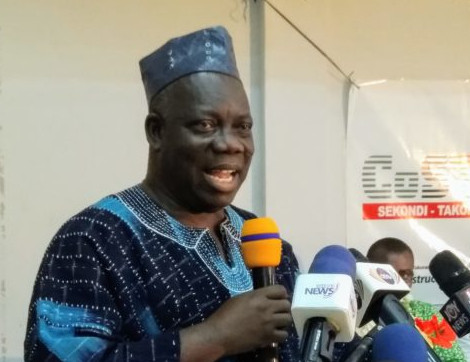
Mayor for STMA, Anthony K.K Sam, has argued that corruption perception of public office holders in the development of public infrastructure is largely influenced by the lack of information on these investments.

Mr Kwadwo Henry Osei-Asante, a Chartered Quantity Surveyor has advocated for the creation of a national Infrastructure Transparency Portal where information on government projects and related contracts would be displayed for the citizenry.
The STMA has become the first subnational government under the Open Governance Partnership (OGP ) to be admitted by the Infrastructure Transparency Initiative (CoST) to enhance responsive and transparency in the sector.
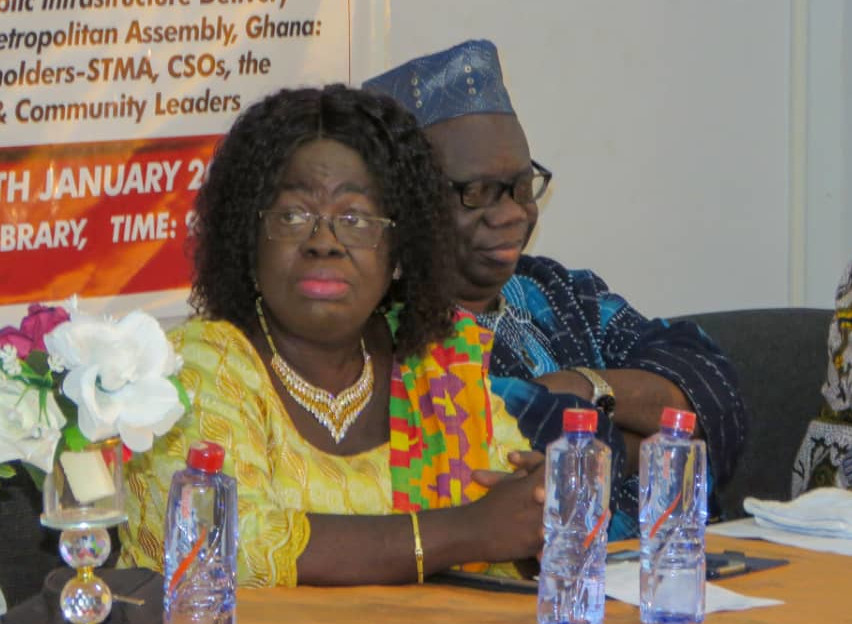
The Deputy Western Regional Minister, Mrs Gifty Eugenia Kusi has said stopping the perceived or real corruption in the infrastructure sector was critical in ensuring durable projects that could stand the test of time and promote economic well-being.
The Infrastructure Analytical Dashboard (IAD) is a business intelligence tool that provides a comprehensive overview of disclosed infrastructure data. The tool analyses multiple infrastructure datasets drawn from projects publicized on CoST Sekondi-Takoradi’s Disclosure Portal by 8 local government authorities (procuring entities) currently working with the organization. The IAD generates statistical and interactive infographic use cases that provide insights on value-for-money considerations, tender management, and contract administration; and quantitatively categorizes projects according to the Sustainable Development Goals (SDGs).

Access to easily understandable infrastructure data can greatly benefit individuals, organizations, and governments in making informed decisions and optimizing resource allocation. However, the bulk and complexity of datasets can be overwhelming, especially for users who are not familiar with data analysis or lack technical expertise to analyse complex data. This may lead to misinterpretation; leading to flawed conclusions, or biased decision-making.
Therefore, presenting complex datasets through visualizations enable multiple stakeholders (government, the private sector, civil society, media, and citizens) to interact and efficiently visualize complex information to identify and understand potentially significant trends associated with the delivery of publicly-funded infrastructure projects. Visual representations provide unique insight by aiding decision-makers and other stakeholders to grasp hitherto complex datasets or information items to inform infrastructure reform.
With the added ability to filter data according to multiple variables and interactive visualizations, the IAD enables users to filter data, drill down into details, and explore different aspects of the presented information.

With a broad objective of triggering accountability mechanisms and driving reform by using compelling infographics to ensure data usage, the development of the IAD went through 3 phases.

Here's how different stakeholders can utilize an analytical dashboard for social accountability and reform: